FACS - Fluorescence-Activated Cell Sorting
Cell Phenotyping platform uses FACS - Fluorescence-Activated Cell Sorting - to support pre-clinical and clinical PoC studies in immunology, cancer research,stem cell studies, and various other fields where understanding and isolating specific cell populations is crucial.
Thanks to this platform it is possible to investigate the heterogeneity of cellular populations and gain insights into the roles of different cell types in biological processes and diseases.
Cell Phenotyping Platform
Full flow cytometry services (FACS services) from experimental design to specimen processing, acquisition (3 lasers 405 nm, 488nm, 640nm),
and data analysis.
CELL PHENOTYPING AT A GLANCE
a brief review of our platform
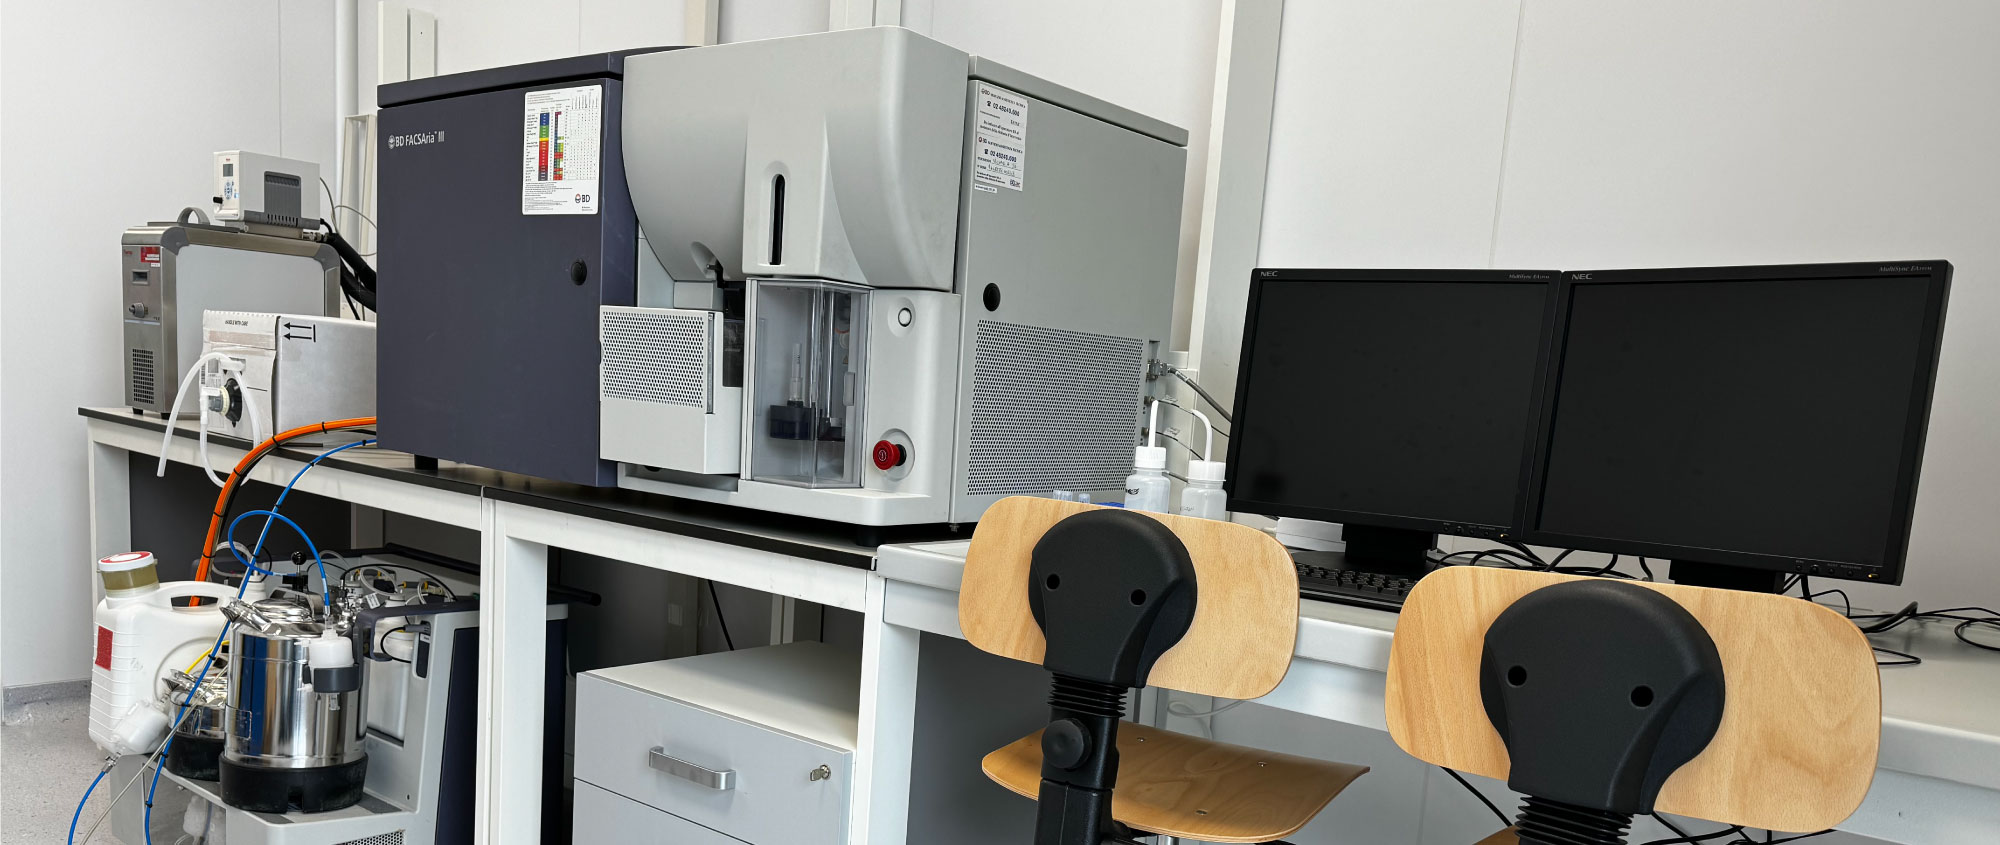
Becton Dickinson FACSARIA III CELL SORTER
Cells
1. ASSAYS
Cell Phenotyping
- Analysis of extracellular markers, mono- and multi-parametric analysis (i.e. receptors, adhesion molecules, costimulatory molecules and MHC);
- Analysis of intracellular markers and cytokines, chemokines and growth factors.
PBMC analysis of subpopulations
- Th1, Th2, Th17, naive, Treg, memory, effector cells;
- Simultaneous staining for intracellular cytokines and cellular populations.
Cell supernatant analysis
- Multi-analyte detection: – Th1 Th2 Th17, inflammatory cytokines panels.
Cell sorting
Functional assays
- cell signaling;
- cell cycle;
- degranulation
- phosphorylation
2. READOUTS
Cell Phenotyping
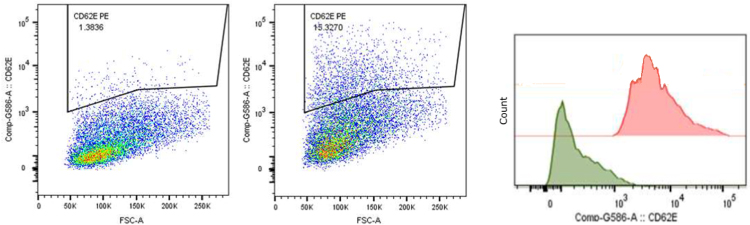
CD62E expression on endothelial cells unstimulated (left panel) and stimulated with TNFa (middle panel). Histograms display PE-G586 fluorescence intensity before (in green) and after (in red) TNFa stimulation.
Intracellular Staining
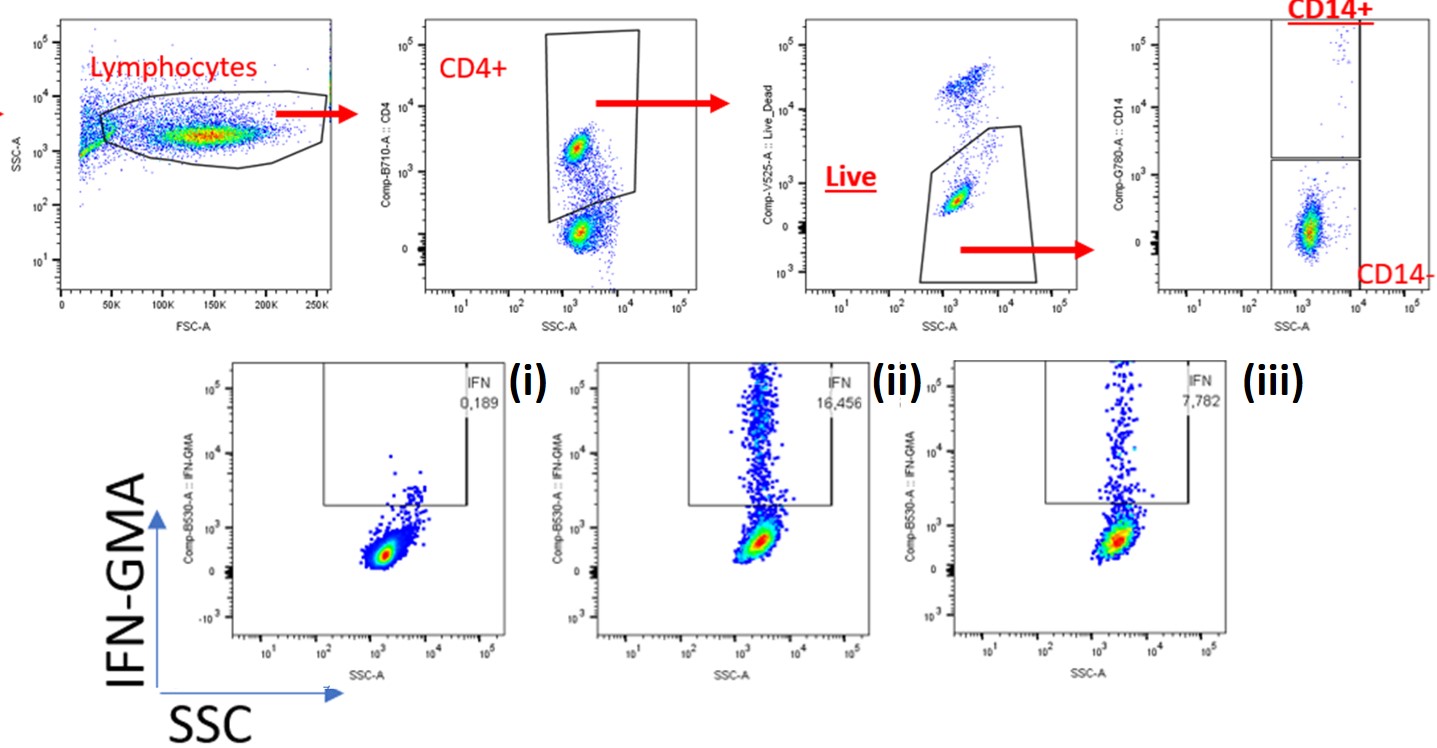
Interferon-g production in CD4+ lymphocytes upon stimulation with PMA/Ionomycin. Representative FACS plots of gating strategy for CD14- CD4+ cells (upper panels). Intracellular staining for Interferon-g in unstimulated cells (i), and PMA/Iono activated cells in absence (ii) or presence of immunomodulator (iii) (lower panels).
Extracellular vesicles
1. ASSAYS
Microvesicle or Exosome Analysis
- Qualitative:
- Analysis of extracellular markers, mono- and multi-parametric analysis (i.e. receptors, adhesion molecules, costimulatory molecules and MHC);
- Analysis of intracellular markers and cytokines, chemokines and growth factors.
- Quantitative:
- Quantitative analysis for characterization specific microvesicles-subsets.
Microvesicle sorting
2. READOUTS
Plasma EVs
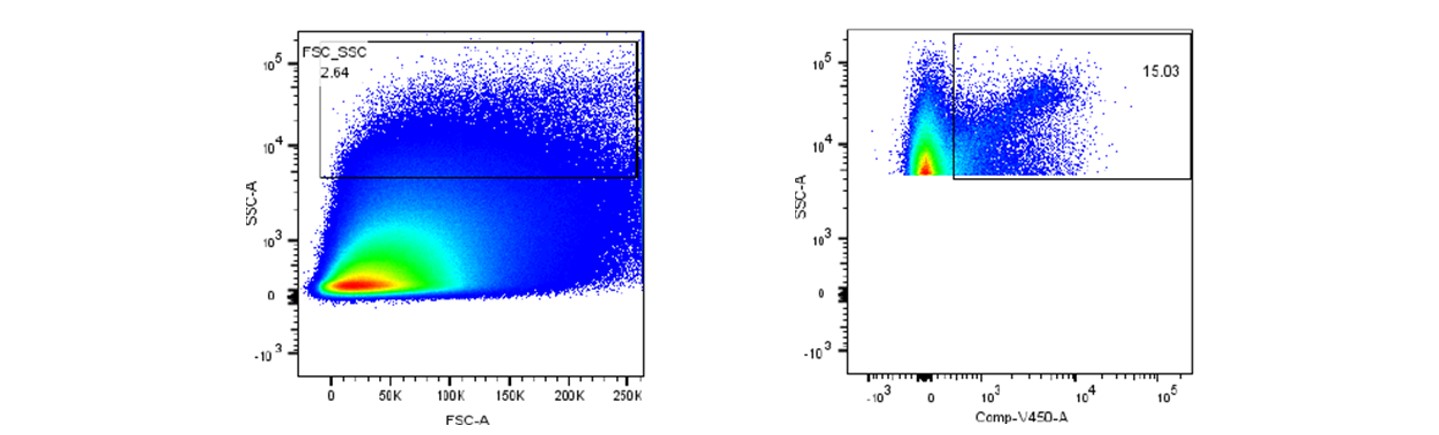
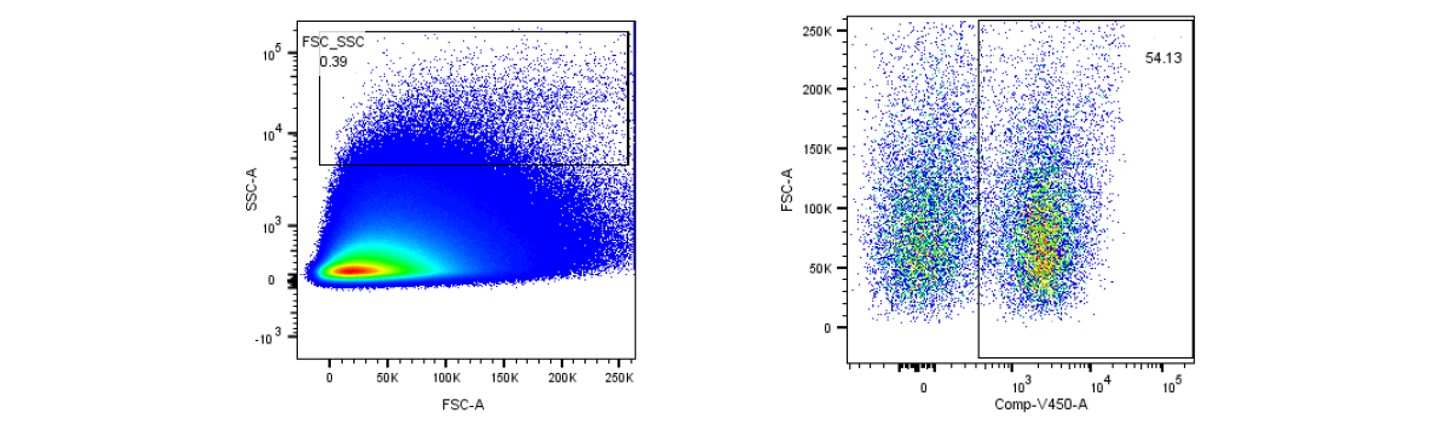
Plasma-derived and Tears-derived EVs stained with Violet 450 dye. In the left panels, the dimensional gate identifies EVs with 180-900 nm size. In the right panels, the gate shows fluorescently stained EVs population.
Tears EVs
Representative sorting layout for Plasma EVs
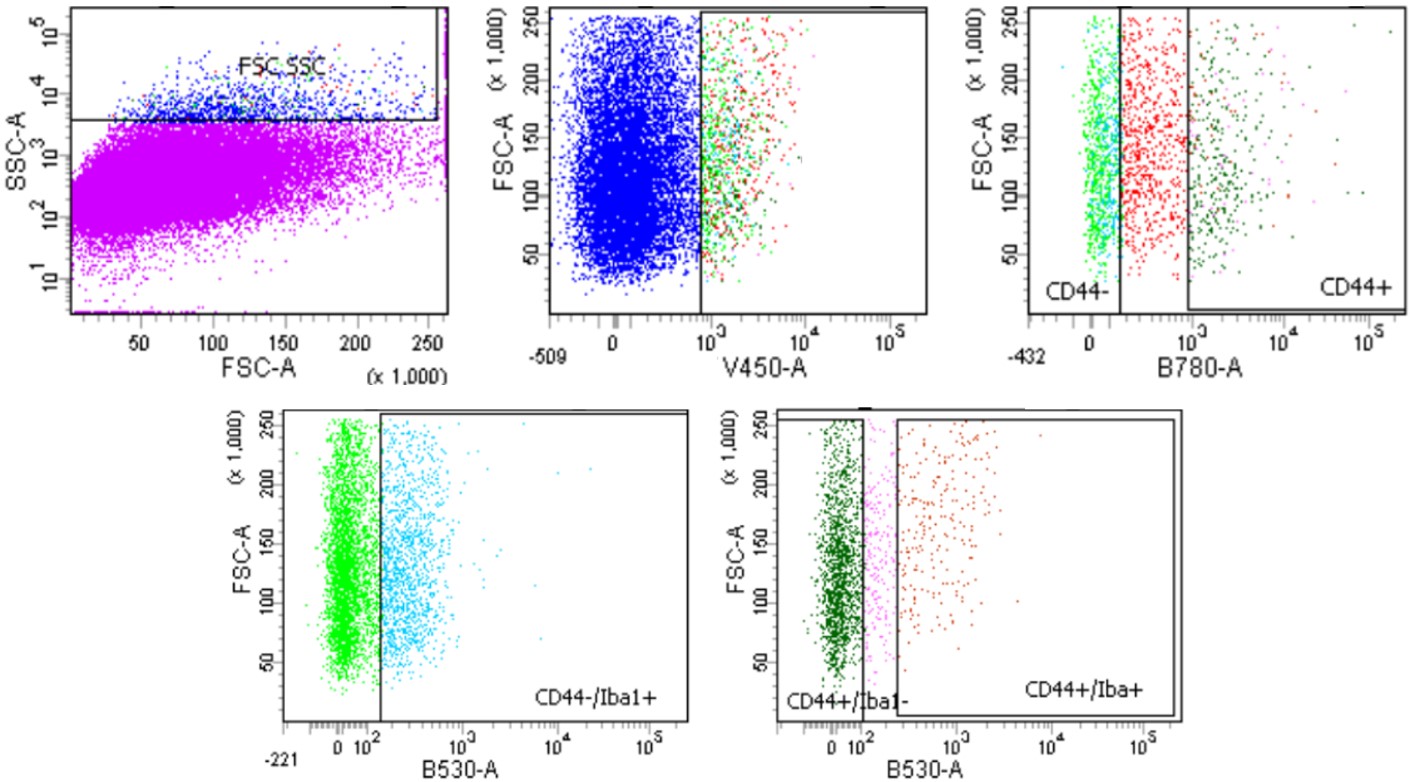
Gating strategy for EVs sorting. Different EVs populations were identified by immunostaining for specific markers.